By Moreno Garcia and Vlad Zolotarov, ScyllaDB. Originally posted at https://www.scylladb.com/2018/08/09/cost-containerization-scylla/
The ubiquity of Docker as a packaging and deployment platform is ever growing. Using Docker containers relieves the database operator from installing, configuring, and maintaining different orchestration tools. In addition, it standardizes the database on a single orchestration scheme that is portable across different compute platforms.
There is, however, a performance payoff for the operational convenience of using containers. This is to be expectedbecause of the extra layer of abstraction (the container itself), relaxation on resource isolation, and increased context switches. This solution is known to be computationally costly, which is exacerbated on a shard-per-core architecture such as Scylla. This article will shed light on the performance penalties involved in running Scylla on Docker, where the penalties are coming from, and the tuning steps Docker users can take to mitigate them. In the end, we demonstrate that it is possible to run Scylla on Docker containers by paying no more than a 3% performance penalty in comparison with the underlying platform.
Testing Methodology
The initial testing used an Amazon Web Service i3.8xlarge instance as a baseline for performance. Once the baseline performance was established, we used the same workload on a Docker base deployment container and compared the results.
Testing included:
- Max throughput for write workloads
- Latency comparisons at targeted read workload
The hardware and software setup used for testing are described in Appendix B
The different workloads are described in Appendix C.
We tested the same workload in four different configurations:
- AMI: Scylla 2.2 AMI, running natively on AWS without any further tuning
- Docker default: Scylla 2.2 official Dockerhub image without any further tuning
--cpuset: Scylla 2.2 Dockerhub image, but with CPU pinning and isolation of network interrupts to particular cores, mimicking what is done in the Scylla AMI.--network host: Aside from the steps described in –cpuset, also bypassing the Docker virtualized networking by using the host network.
Max Throughput Tests
We chose a heavy disk I/O workload in order to emulate a cost-effective, common scenario. Max write throughput tests were obtained using the normal distribution of partition, in which the median is the half of the populated range and standard deviation is one-third of the median. The results are shown in Figure 1.

Figure 1: Maximum throughput comparison between a Scylla 2.2 AMI running on an AWS i3.8xlarge (blue), and various Docker configurations. With the default parameters meant to run in shared environments, there is a 69% reduction in peak throughput. However, as we optimize, the difference can be reduced to only 3%.
Scylla in a Docker container showed 69% reduction on write throughput using our default Docker image. While some performance reduction is expected, this gap is significant and much bigger than one would expect. We attribute it to the fact that none of the close-to-the-hardware optimizations usually employed by Scylla are present. The results get closer to the underlying platform’s performance when Scylla controlled the resources and allocated the needed tasks to the designated CPU, IO channel, and network port. A significant portion of the performance was recovered (11% reduction) with CPU Pinning and perftune.py (to tune the NIC and disks in the host) script execution. Going even further, using the host network and removing the Docker network virtualization using the --network host parameter brought us to a 3% reduction on overall throughput. One of the strong Docker features is the ability to separate networking traffic coming to each Docker instance on the same machine (as described here). If one uses the --network host parameter, he/she will no longer be able to do that since Docker is going to hook up to the host networking stack directly.
Latency Test Results
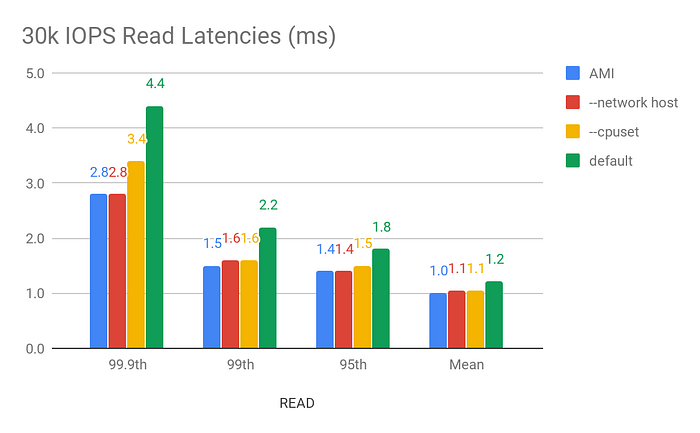
To achieve the best latency results, we issued a read workload to the cluster at a fixed throughput. The throughput is the same for all cases to make the latency comparison clear. We executed the tests on the wide range of the populated data set for 1 hour, making sure that the results are coming from both cache and disk. The results are shown in Figure 2.

Figure 2: 99.9th, 99th, 95th and average latency for a read workload with fixed throughput with the Scylla 2.3 AMI, in blue, and with the various Docker configurations. There is a stark increase in the higher percentiles with the default configuration where all optimizations are disabled. But as we enabled them the difference essentially disappears.
While the difference in percentage (up to 40%) might be significant from the AMI to the Docker image, the numerical difference is in the single digit millisecond. But after network and CPU pinning and removing the Docker network virtualization layer, the differences become negligible. For users who are extremely latency sensitive, we still recommend using a direct installation of Scylla. For users looking to benefit from the ease of Docker usage, the latency penalty is minimal.
Analysis
We saw in the results of the previous runs that users who enable specific optimizations can achieve with Docker setups performance levels very close to what they would in the underlying platform. But where is the difference coming from?
The first step is obvious: Scylla employs a polling thread-per-core architecture, and by pinning shards to the physical CPUs and isolating network interrupts the number of context switches and interrupts is reduced.
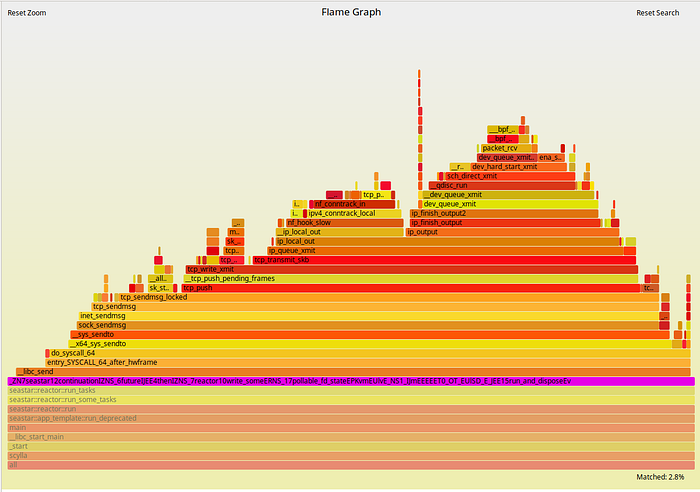
As we saw, once all CPUs are pinned we can achieve throughput that is just 11% worse than our underlying platform. It is enlightening at this point to look at Flamegraphs for both executions. They are presented in Figures 3 and 4 below:

Figure 3: Flamegraphs obtained during a max-throughput write workload with the Scylla 2.2 AMI.

Figure 4: Flamegraphs obtained during the same workload against Scylla running in Docker containers with its CPUs pinned and interrupts isolated.
As expected, the Scylla part of the execution doesn’t change much. But to the left of the Flamegraph we can see a fairly deep callchain that is mostly comprised of operating system functions. As we zoom into it, as shown in Figures 5 and 6, we can see that those are mostly functions involved in networking. Docker virtualizes the network as seen by the container. Therefore, removing this layer can bring back some of the performance as we saw in Figures 1 and 2.

Figure 5: Zooming in to the Flamegraphs. The Scylla 2.2 AMI.

Figure 6: Scylla running on Docker with all CPUs pinned and network interrupts isolated.
Where Does the Remaining Difference Come From?
After all of the optimizations were applied, we still see that Docker is 3% slower than the underlying platform. Although this is acceptable for most deployments, we would still like to understand why. Hints as to why can be seen in the very Flamegraphs in Figures 3–6. We see calls to seccomp that are present in the Docker setup but not in the underlying platform. We also know for a fact that Docker containers are executed within Linux cgroups, which are expected to add overhead.
We disabled security profiles by using the --security-opt seccomp :unconfined Docker parameter. Also, it is possible to manually move tasks out of cgroups by using the cgdelete utility. Executing the peak throughput tests again, we now see no difference in throughput between Docker and the underlying platform. Understanding where the difference comes from adds educational value. However, as we consider those to be essential building blocks of a sane Docker deployment, we don’t expect users to run with those disabled.
Conclusion
Containerizing applications is not free. In particular, processes comprising the containers have to be run in Linux cgroups and the container receives a virtualized view of the network. Still, the biggest cost of running a close-to-hardware, thread-per-core application like Scylla inside a Docker container comes from the opportunity cost of having to disable most of the performance optimizations that the database employs in VM and bare-metal environments to enable it to run in potentially shared and overcommitted platforms.
The best results with Docker are obtained when resources are statically partitioned and we can bring back bare-metal optimizations like CPU pinning and interrupt isolation. There is only a 10% performance penalty in this case as compared to the underlying platform — a penalty that is mostly attributed to the network virtualization. Docker allows users to expose the host network directly for specialized deployments. In cases in which this is possible, we saw that the performance difference compared to the underlying platform falls down to 3%.
Appendix A: Ways to Improve Performance in a Containerized Environment
As we demonstrated in previous articles like An Overview of Scylla Architecture and its underlying framework Seastar, Scylla uses a shared-nothing approach and pins each Scylla shard to a single available CPU.
Scylla already provides some guidelines on how to improve Scylla performance on Docker. Here we present a practical example on an i3.8xlarge AWS instance and showcase how to use network IRQ and CPU pinning.
Network Interrupts
Scylla checks the available network queues and available CPUs during the setup. If there are not enough queues to distribute network interrupts across all of the cores, Scylla will isolate some CPUs for this purpose. Also, if irqbalance is installed it will add the CPUs dedicated to networking to the list of irqbalance banned CPUs. For that Scylla uses the perftune script, distributed with Scylla packages. It is still possible to run the same script in the host in preparation for running Docker containers. One caveat is that those changes are not persisted and have to be applied every time the machine is restarted.
In the particular case of i3.8xlarge perftune will isolate CPUs 0 and 16 for the sole purpose of handling network interrupts:
For proper isolation, the CPUs handling network interrupts shouldn’t handle any database load. We can use a combination of perftune.py and hex2list.py to discover exactly what are the CPUs that are free of network interrupts:
Shard-per-core Architecture and CPU Pinning
When we use Scylla inside a container, Scylla is unaware of the underlying CPUs in the host. As a result, we can see drastic performance impact (50%-70%) due to context switches, hardware interrupts, and the fact that Scylla needs to stop employing polling mode. In order to overcome this limitation, we recommend users to statically partition the CPU resources to b assigned to the container and letting the container take full control of its shares. This can be done using the --cpuset option. In this example, we are using an i3.8xlarge (32 vcpus) and want to run a single container in the entire VM. We will pass --cpuset 1,15-17-31 ensuring that we pin 30 shards to 30 vCPUs. The two remaining vCPUs will be used for network interrupts as we saw previously. It is still possible to do this when more than one container is present in the box, by partitioning accordingly.
Appendix B: Setup and Systems Used for Testing (AWS)
Hardware
Throughput tests
1 x i3.8xlarge (32 CPUs 244GB RAM 4 x 1900GB NVMe 10 Gigabit network card) Scylla node
2 x c4.8xlarge (36 CPUs 60GB RAM 10 Gigabit network card) writers running 4 cassandra-stress instance each.
Latency tests
1 x i3.8xlarge (32 CPUs 244GB RAM 4 x 1900GB NVMe 10 Gigabit network card) Scylla node
2 x c4.8xlarge (36 CPUs 60GB RAM 10 Gigabit network card) readers running 4 cassandra-stress instance each.
Software
Scylla 2.2 AMI (ami-92dc8aea region us-west-2 [Oregon])
Docker version 1.13.1, build 94f4240/1.13.1
Perftune.py from scylla-tools
Provisioning Procedure
AMI
AMI deployed using AWS Automation
Docker
Docker --cpuset
Docker --network host
Appendix C: Workloads
Dataset
5 Columns, 64 bytes per column, 1500000000 partitions. Total Data: ~480GB
2 Loaders running 1 cassandra-stress, 750000000 interactions each
cassandra-stress commands:
Loader 1:
Loader 2:
Write Max Throughput Test
2 Loaders running 4 cassandra-stress each for 1 hour.
cassandra-stress commands:
Loader 1:
Loader 2:
30K IOPs Read Latency Test
2 Loaders running 4 cassandra-stress each for 1 hour.
cassandra-stress commands:
Loader 1:
Loader 2:
